Patterns
Inside Bar Pattern
Learn what an inside bar is, how it forms, and how traders practice reading it in context instead of treating it as a signal by itself.
Updated 2026-05-14
An inside bar is a candle whose range sits inside the range of the previous candle. The previous candle is often called the mother bar.
In simple terms, the current candle has a lower high and a higher low than the candle before it.
What an inside bar shows
An inside bar shows compression. Price moved within a smaller range than the previous candle.
That compression can happen before continuation, reversal, or more sideways movement. The pattern itself is not a complete trading plan.
How to identify it
Compare the inside bar with the previous candle:
- The inside bar high should be below the mother bar high.
- The inside bar low should be above the mother bar low.
- The full range of the inside bar should fit inside the previous candle range.
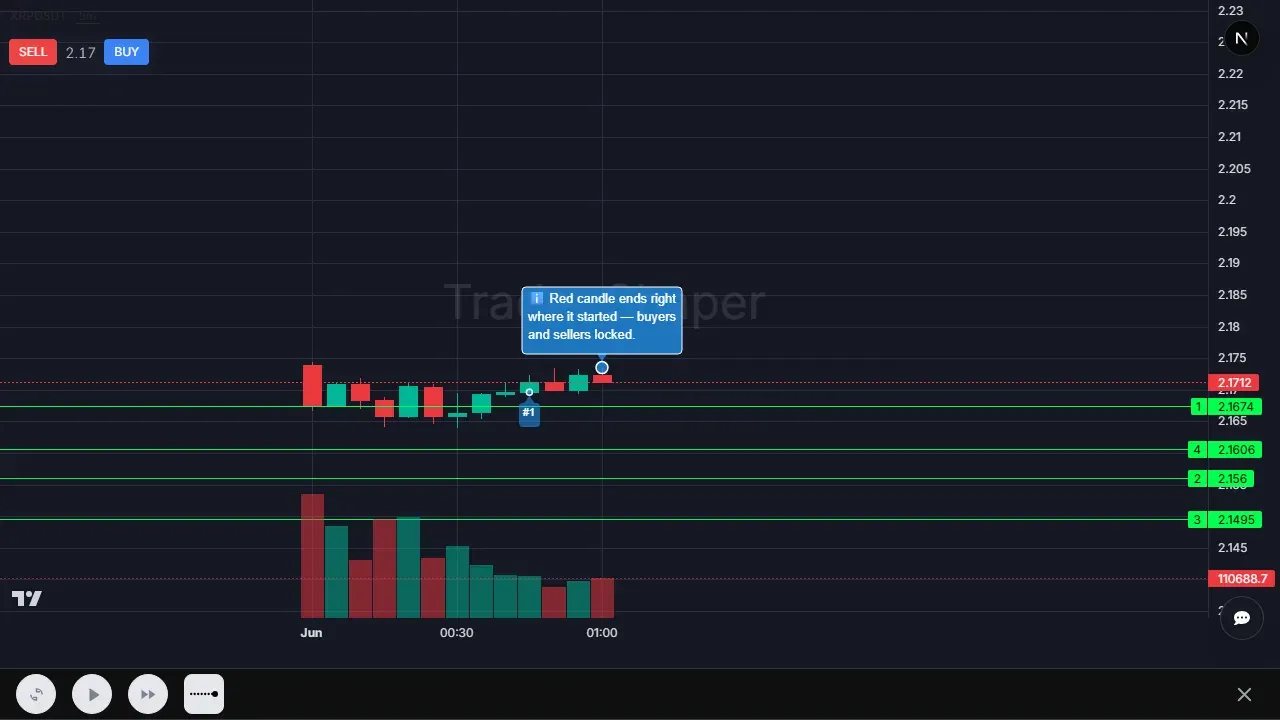
What to notice in the app screenshot
The chart below shows the situation an inside bar is meant to train: the move has slowed and the candles are compressing. The key is not prediction. The key is recognizing that the current candle is no longer extending the range. That tells you the market is pausing before the next decision.
Inside bar checklist
- Find the mother bar first.
- Compare high to high and low to low.
- Check the pattern in the surrounding trend or range.
- Notice whether the pattern forms near support or resistance.
- Avoid treating the pattern as a buy or sell signal by itself.
Context matters
An inside bar after a strong trend can show a pause. An inside bar near support or resistance can show compression before a decision. An inside bar in the middle of a messy range may be less useful.
The skill is not just spotting the pattern. The skill is reading where it appears.
Good and weak inside bars
A good inside bar is easy to see at normal zoom. The mother bar has a meaningful range, and the inside bar clearly stays inside it. That contraction says the market moved from expansion to compression. It does not say which side must win next.
A weak inside bar is usually too small to matter or buried inside random chop. If the mother bar was already tiny, the inside bar may only show more indecision. If the pattern forms in the middle of a range, far from a level or swing point, the compression may not be useful.
Location changes the read. An inside bar after a strong directional candle can show a pause before continuation. An inside bar at resistance after a rally can show buyers failing to extend. An inside bar at support after a selloff can show sellers losing momentum. Same shape, different chart story.
How to practice inside bars
First identify the mother bar. Without the mother bar, there is no inside bar to compare against. Then check whether the next candle’s high is below the mother bar high and its low is above the mother bar low. Use the full range, not just the body.
After the shape is confirmed, stop and read context before imagining a trade. Ask whether the pattern formed after expansion, at a key area, or inside a messy range. The best practice answer includes both parts: “yes, inside bar” and “high-quality or low-quality because…”
Finally, watch the resolution without assuming it. Inside bars can break up, break down, or fail both ways. The useful skill is recognizing compression and waiting for evidence, not guessing the direction from the name of the pattern.
For practice, collect both successful and failed inside bars. The failures are important because they show what the pattern cannot tell you. An inside bar can identify compression, but the breakout candle, location, and surrounding structure decide whether that compression mattered.
Practice goal
Practice finding inside bars without rushing into a trade idea. First identify the mother bar, then confirm whether the next candle is fully inside its range.
After that, ask what the broader chart is doing.